Pulling data off a power meter with a Raspberry Pi and Modbus
We've just had the house rewired, to replace a 1970s DDR-style system of aluminium cabling, screw-in fuses and a fusebox prominently displayed on an upstairs landing, with an up-to-current standards installation. That's involved an incredible amount of mess and disruption - virtually every wall in the entire building has been carved into, and there's still holes in ceilings that I haven't got around to patching.
The upside to the work was being able to specify exactly what I wanted, and where I wanted it. That included a new distribution board with space for the eventual solar and wallbox installs, as well as plenty of spare circuits. I also wanted to get control over the data that the system creates, and that involved a more-complex-than-usual metering setup.
The supplier's meter is a two-way digital model, but it's closed - there's no way of pulling data off it short of sticking a pulse reader on the front and counting flashes. That's ok for most purposes, but I wanted more granular data. The solution is actually fairly simple, but it is the kind of thing that's optimally done when the whole system is being worked on - add a second meter.
The system's arranged like this:
supplier feed --> supplier meter --> secondary meter --> circuits
The secondary meter is connected in series with the supplier meter on my side of the responsibility divide. All the phases pass through it, so it's effectively recording exactly the same data as the closed supplier box - and crucially has a Modbus RTU interface which allows the data to be read off programmatically. Modbus is a very old, but still very useful, protocol for talking to relatively dumb devices. The physical requirements are about as basic as it's possible to get - two wires and a serial connection.
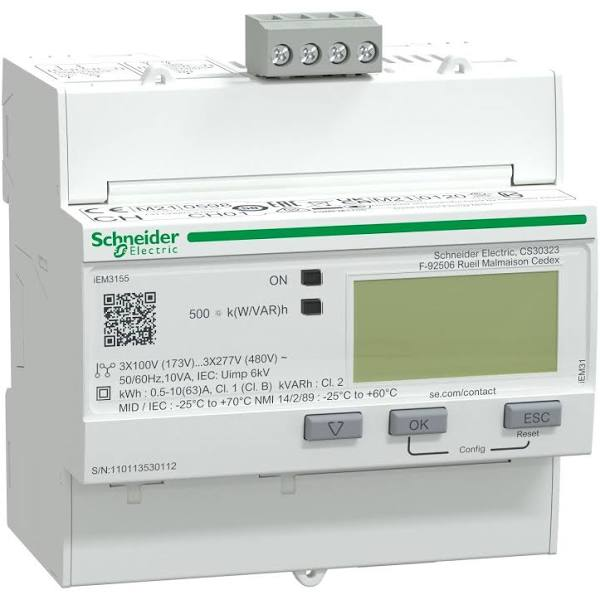
I ended up going with a Schneider Electric iM3155 - the user interface is pretty basic, but it has a Modbus interface that's fully-featured.
By asking the meter for the contents of various data registers, I can get information down to the individual phase level at whatever time granularity I want.

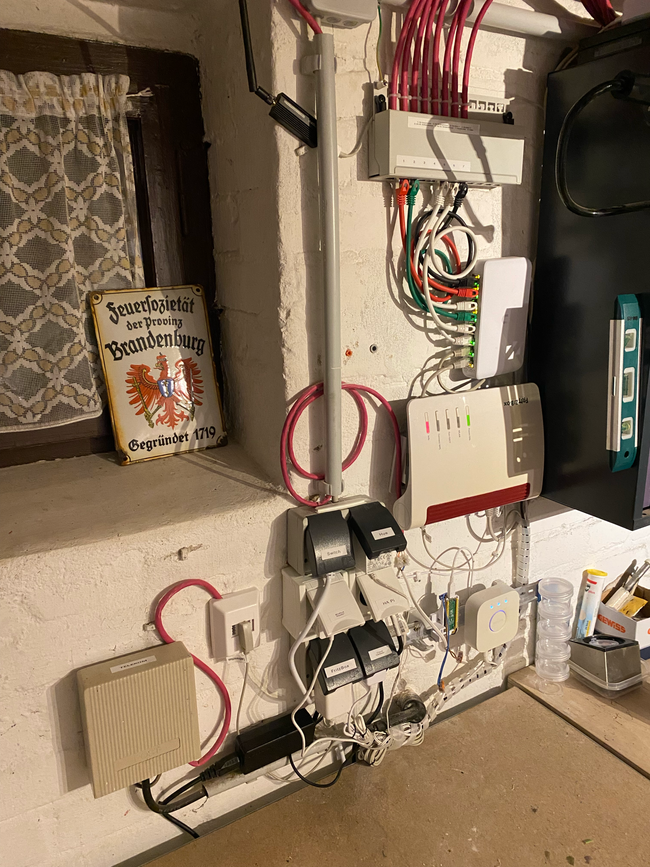
The Modbus interface talks RS485 serial over two lines which I've wired into one pair of a Cat7 cable which gets routed across the cellar to the Wall Of Networking Equipment (net curtains and tool cabinets leftovers from the previous owners, the mess of cables very much mine. It's not quite as chaotic as it looks, but cramming everything into a relatively small space while working around pre-existing things like a Telekom cable the size of a transatlantic link did end up with some compromises...)

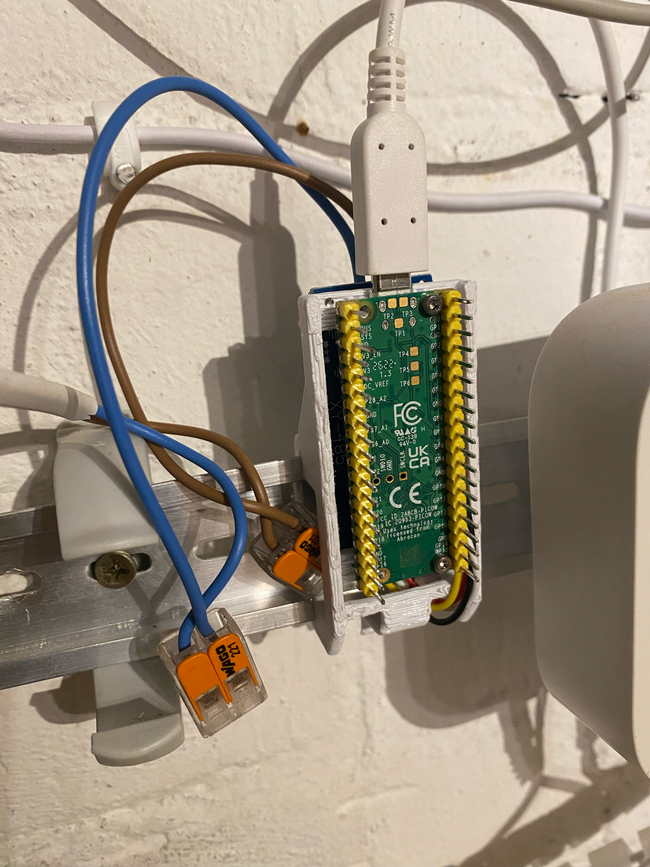
At the other end of the cable to the meter is an RS485 to TTL converter board which is in turn connected to 2 of the GPIO pins of a Raspberry Pi Pico W. The Pi's mounted on one side of a 3d-printed DIN rail mount, and the RS485 converter is on the other side. Eventually I'll get around to making the cabling a bit neater and get rid of the DuPont connectors, but this is all work-in-progress at the moment.

[Sidenote: DIN rails are a really useful way of mounting stuff - they're dirt-cheap, can be screwed to practically anything at any angle or orientation, and there's a vast array of 3D printable clips and mounts which means there's no end of the things that you can clip to them]
My first idea was to use Home Assistant and ESP Home to setup the Pi to poll the meter, but that was painful to configure (cough YAML cough) so I decided to fall back to something more familiar and Just Write Code.
The Pi runs a simple HTTP server written in Micropython which uses the umodbus library to talk to the meter, and send back the retrieved data as a JSON blob whenever the endpoint is queried. That decouples the whole thing from a monolith like Home Assistant and means the data can be consumed by anything that can handle JSON over HTTP. The modbus register is passed over as a parameter, the Pi calls the meter for the data, formats it into something useful, and then spits back the result as JSON. The meter captures a whole range of stats, the useful ones of which are configured as Home Assistant sensors.
The main use at the moment is to pull consumption stats off at 60 second intervals - that gives me a really granular view of how much power is being consumed at any moment in time, as well as being able to see what (if anything) is being fed back from the solar panels. I've not got a full roof system yet, but a pair of panels leaned up against a wall in the garden can produce 500W on a sunny day, so even in November I've fed back about 2kW in total during the periods where we're using relatively little in terms of power in the house.
There's also a whole load of other less-immediately useful data like reactive and apparent power consumption and generation - it would be a pretty scary domestic scenario where those kind of numbers became useful, but you can also do things like set up variable tariff rates and multi-consumer stats and so on.
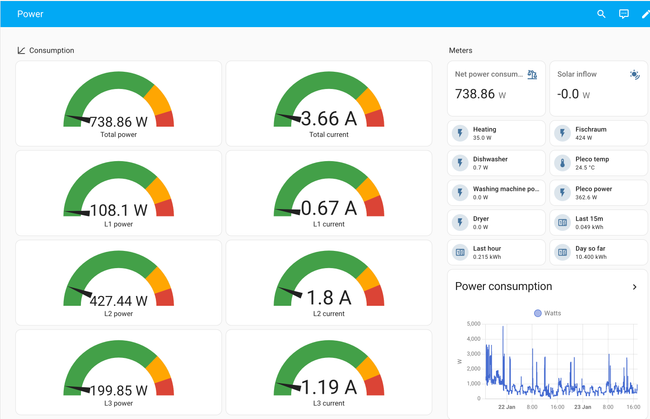
Combine that with the data being fed from individual devices, and it's all presented in a Home Assistant dashboard (Modbus data is displayed in the graphs, with single-device values in the small panels):

Eventually I'll be able to dig deeper into the data that the meter provides (everything's available on a phase-by-phase basis, and the Modbus interface allows for resetting registers like in- and outflows at will) But for now, it's enough to have a minute-by-minute graph, and then use that in the future to help with time-shifting loads once we move to a variable tariff and have PV generation and battery storage.
The whole process has also been an insight into just how useful tiny boards like the Pi Pico and ESP32 are for single purposes that need code to run. The total cost of the bill of materials probably runs to about 8€ if you exclude things like the screws and the 3D print filament. The boards are also tiny (the Pi Pico is an obese monster compared to some of them), so they're really easy to squeeze into things. I can see myself using a lot more of them in the future.